Every screenshot below is an unedited capture of the actual application — the web terminal, which is what the installer opens by default. No mockups, no compositing, no staged numbers. Nine of the ten numbered screens were grabbed in one sitting on the evening of 2026-08-07, after the US close, on real feeds — which is why they all quote the same last print rather than a moving tape, and why the dashboard’s price panels each stamp themselves session closed. Two sets of frames are not from that sitting, and neither pretends to be: screen 05 is an earlier capture from the same Friday, taken with the tape still running and clocked MKT OPEN 12:14:10 ET, so its ticker reads 773.11 where the evening nine read 773.26; and the four Data Center figures at the end were taken the next morning, Saturday 2026-08-08, so they read SESSION OVERNIGHT over a quote stamped as of Fri 16:00 ET. Where a panel has nothing to show it says so instead of inventing a sample, and where a statistic hasn’t earned the right to be printed the app withholds it in as many words.
That last part is the reason this page exists, so read for it: INSUFFICIENT stamped on seven of our own nine models, WITHHELD on three backtest metrics with the reasoning printed underneath, a confidence gauge that stays hollow beside the words EDGE UNPROVEN, a win rate rendered as a dash because there are no closed trades, a red banner on our own trading engine warning that seven positions left on the book are not being marked or stopped while its loop is off, and idle panels that say Press Scan instead of holding a pre-filled sample. Those are not screens we failed to populate. They are screenshots of the software refusing to guess, and every one of them is quoted below off the capture beside it.
How to read these captures. Nine of the ten numbered screens were rendered in a 1600×1000 browser viewport at 2× and exported at two widths — the 1400 px-wide image this page falls back to, and a 2400 px @2x copy shipped beside it — with the browser choosing between them by your display’s pixel density, so a high-DPI screen gets the denser file rather than an upscaled one. Screen 05, the Algo Bot, is the exception to that: it ships at the 1400 px width alone, so a high-DPI display does upscale it and its small type reads softer than the rest. Re-shooting that screen at 2× would have meant finding a band of the page that shows neither the broker rollup above the frame nor the holdings reference below it, and no such band exists — a soft picture beats publishing one of our accounts. Nothing was cropped, retouched, composited, or overlaid, and no number was typed in by hand. The Control Tower is the exception to the frame size: it was taken in a taller 1600×1716 viewport, because its scorecard, its per-regime table and its model scoreboard only make their point together and we would rather show one long frame than three cropped ones. Five shots are framed below the top of their screen — the Algo Bot at 05, the Portfolio at 10, and three of the four Data Center figures — and in each case the copy beside it says so, and says what sits above the frame. Every other shot is the top of its screen at the moment of capture, and several of these screens run longer than a 1000 px frame — where the copy below quotes a panel that sits under the fold, it says so rather than implying you can see it. That evening sweep ran inside a few minutes, so unlike a live-session sweep the quote does not drift across those nine shots: each of their ticker bars carries the same 773.26 last print and only the clock beside it moves. Screen 05, taken hours earlier with the market open, is the one that reads differently — 773.11, against a 12:14:10 ET clock. The four Data Center figures at the end were taken a day later, on 2026-08-08, and ship at the same two widths — but they are not a different surface. They are this same web terminal, opened from its own sidebar, against a neutral install with no positions and an empty watchlist. Where a shot includes the sidebar it reads 61 SCREENS · 8 MODULES; this tour stops at ten of them.
01Markets
Dashboard
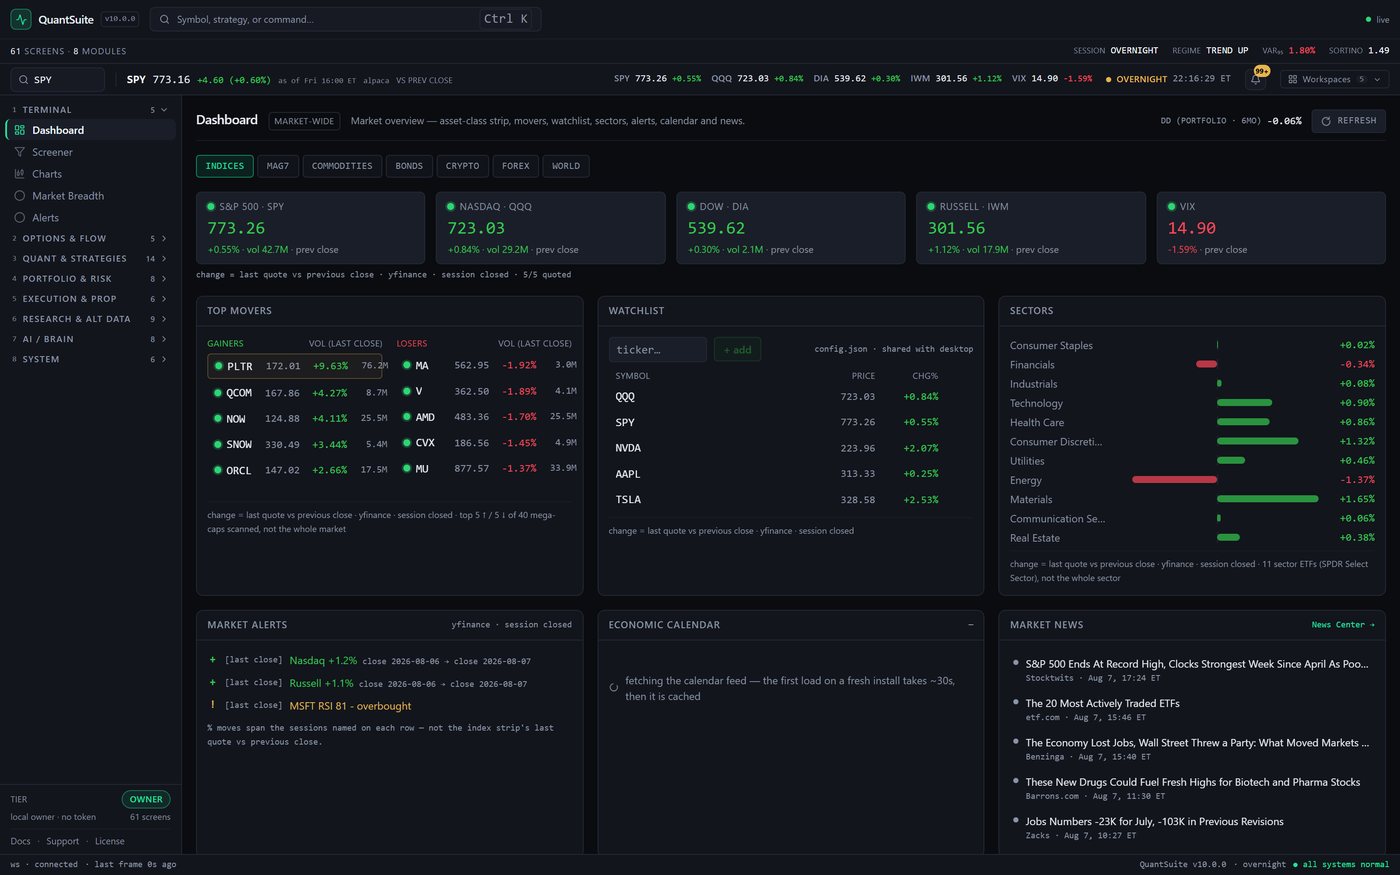
The home screen: an asset-class strip (indices, MAG7, commodities, bonds, crypto, forex, world), a portfolio drawdown tile, top movers, a savable watchlist, market news, sector view, alerts, and an economic calendar.
What the capture actually holds: an index strip reading S&P 500 · SPY 773.26 (+0.55% · vol 42.7M), NASDAQ · QQQ 723.03 (+0.84%), DOW · DIA 539.62 (+0.30%), RUSSELL · IWM 301.56 (+1.12%) and VIX 14.90 (-1.59%); a drawdown tile in the page header reading DD (PORTFOLIO · 6MO) -0.06%. Top movers run from PLTR 172.01 +9.63% to MA 562.95 -1.92%, the sector bars span Materials +1.65% to Energy -1.37%, and the market-alerts panel holds three rows, the last of them MSFT RSI 81 - overbought. The economic calendar holds nothing at all and says why: “fetching the calendar feed — the first load on a fresh install takes ~30s, then it is cached.” We could have waited it out and re-shot the frame; a panel that tells you it is still fetching is worth more to you than one that looks full.
Now read the small grey line under each panel, because that is the actual feature. The index strip is stamped change = last quote vs previous close · yfinance · session closed · 5/5 quoted. Top Movers repeats the basis and then bounds its own scope: top 5 ↑ / 5 ↓ of 40 mega-caps scanned, not the whole market. The sector row bounds itself the same way — 11 sector ETFs (SPDR Select Sector), not the whole sector. And the alerts panel — whose first row reads Nasdaq +1.2% close 2026-08-06 → close 2026-08-07 — carries a different note entirely: % moves span the sessions named on each row — not the index strip’s last quote vs previous close. Two panels on one screen can quote the same ticker over two different windows, so each one names its window rather than letting you assume they agree.
Real captureUnedited · SPY 773.26 · VIX 14.90 · every panel stamped session closed with its own price basis · the calendar says it is still fetching rather than showing a sample
02Markets
Charts & Technicals
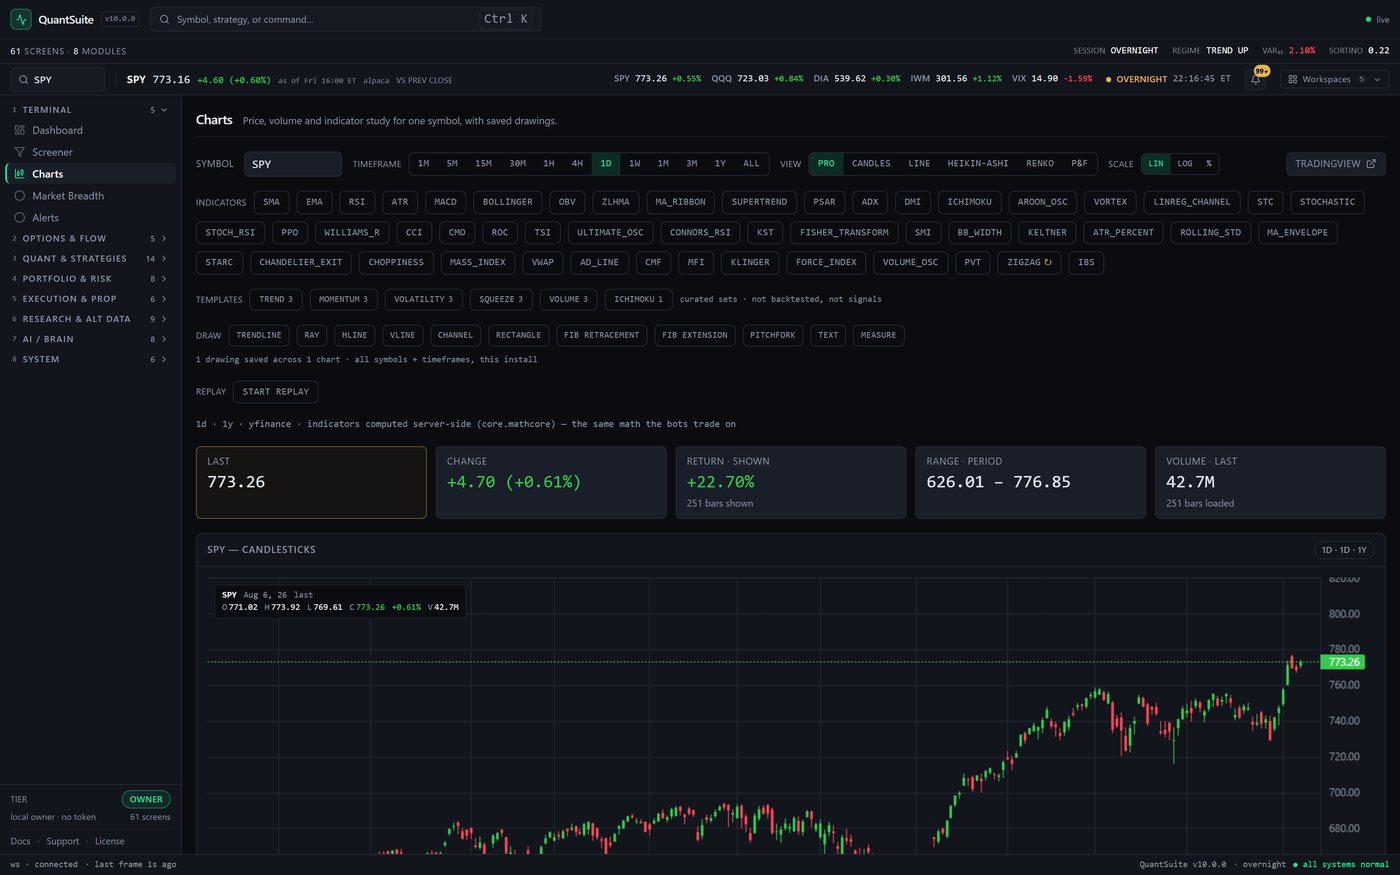
Interactive candlestick charts with timeframes from 1-minute to all-history, five view modes (candles, line, Heikin-Ashi, Renko, point-and-figure), linear / log / percent scaling, a drawing layer that persists across symbols, and a bar-replay mode. The indicator rail visible in the capture runs from SMA and RSI through ICHIMOKU, SUPERTREND, KLINGER and CONNORS_RSI — fifty studies, plus six curated template sets which the app is careful to label curated sets · not backtested, not signals. The drawing row keeps its own count honest too: 1 drawing saved across 1 chart · all symbols + timeframes, this install.
Captured on SPY, 1-day bars over a year: LAST 773.26, CHANGE +4.70 (+0.61%), RETURN · SHOWN +22.70% over 251 bars, RANGE · PERIOD 626.01 – 776.85, VOLUME · LAST 42.7M. The crosshair box on the chart is reading the last bar — SPY Aug 6, 26 · O 771.02 H 773.92 L 769.61 C 773.26 · +0.61% · V 42.7M. Note the label on the return tile: it says shown, and the line beneath it says 251 bars shown against the range tile’s 251 bars loaded. It is the return over the window you are looking at, not an annualised figure dressed up as performance.
Two lines of small print do real work here. The basis line above the tiles reads 1d · 1y · yfinance · indicators computed server-side (core.mathcore) — the same math the bots trade on: the chart is not running a second, friendlier copy of the indicators. And under the chart, below the bottom of this frame, its legend: scroll zoom · drag pan · warmup bars render as gaps, never zeros. A 200-period average has no value on bar 3, and the app draws nothing there rather than a zero that would look like a crash.
Real captureSPY · 1d · 1y · LAST 773.26 · RETURN SHOWN +22.70% over 251 bars · “warmup bars render as gaps, never zeros”
03Options
Options Lab — the recommender’s own report card
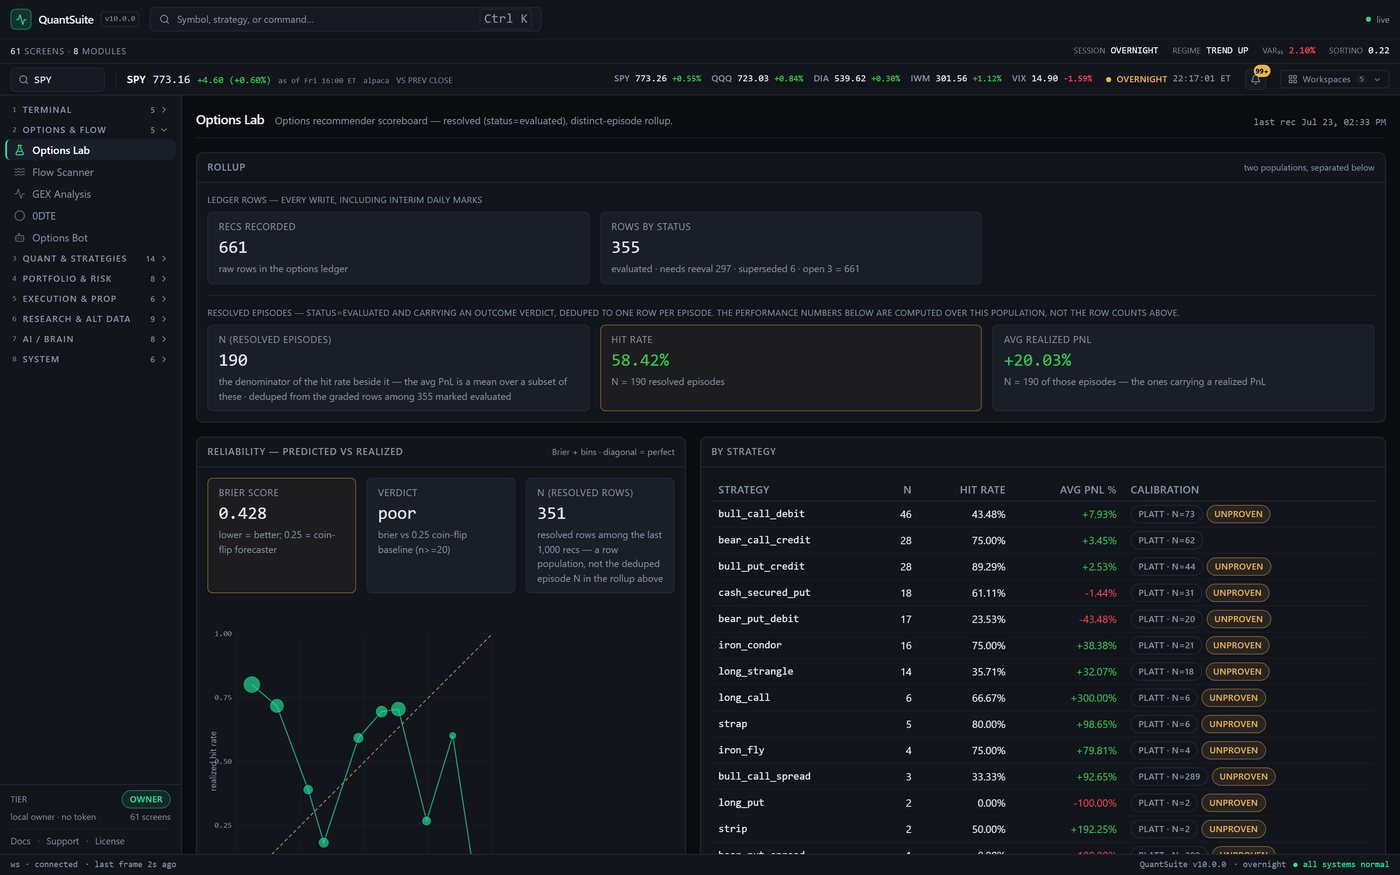
The Options Lab is where the options recommender is graded, not where it is advertised. Its subtitle states the population it is scoring: “Options recommender scoreboard — resolved (status=evaluated), distinct-episode rollup.” Every recommendation the engine has ever made is written to a ledger, marked against realized prices later, and totalled here. The header dates the ledger rather than the visit: last rec Jul 23, 02:33 PM.
Watch the arithmetic at the top, because most software would not show you this. RECS RECORDED 661 — raw rows in the options ledger. Beside it, ROWS BY STATUS 355, broken out as evaluated · needs reeval 297 · superseded 6 · open 3 = 661. Then a banner in capitals separates the two populations: the resolved episodes are deduped to one row per episode, and the performance numbers below are computed over this population, not the row counts above. So the headline is N (RESOLVED EPISODES) 190, HIT RATE 58.42%, AVG REALIZED PNL +20.03% — a 58% hit rate quoted against 190, not against the 661 that would have made it look better-sampled.
The bottom half is the part we would delete if this page were marketing. BRIER SCORE 0.428, annotated lower = better; 0.25 = coin-flip forecaster, and the verdict box next to it says one word: poor. Our own probability estimates are worse than a coin flip, and the app prints that on the screen it opens with — over a third population it also names, N (RESOLVED ROWS) 351, a row population, not the deduped episode N in the rollup above. The reliability chart under it, whose bin table continues below this frame, is where that verdict comes from: the most confident bucket on the board, 90–100% predicted, holds two recommendations at a mean predicted 93.62% and a realized rate of 0.00%.
In the by-strategy table, twelve of the thirteen rows in frame carry an amber UNPROVEN stamp — including bull_put_credit, which at 89.29% over 28 has the best-looking hit rate on the board. Only bear_call_credit (28, 75.00%) is unstamped, and the fourteenth row below the fold, bear_put_spread, is stamped too. The strategy that looks best is not the one the calibration passes, and the footnote spells out what the stamp means: the per-strategy calibration fit has not cleared the honesty gate — treat its probability as informational.
Real captureVerdict: poorOur own recommender, graded — N=190 · hit 58.42% · Brier 0.428 vs a 0.25 coin flip · 12 of the 13 strategies in frame stamped UNPROVEN
04Options
Options Bot
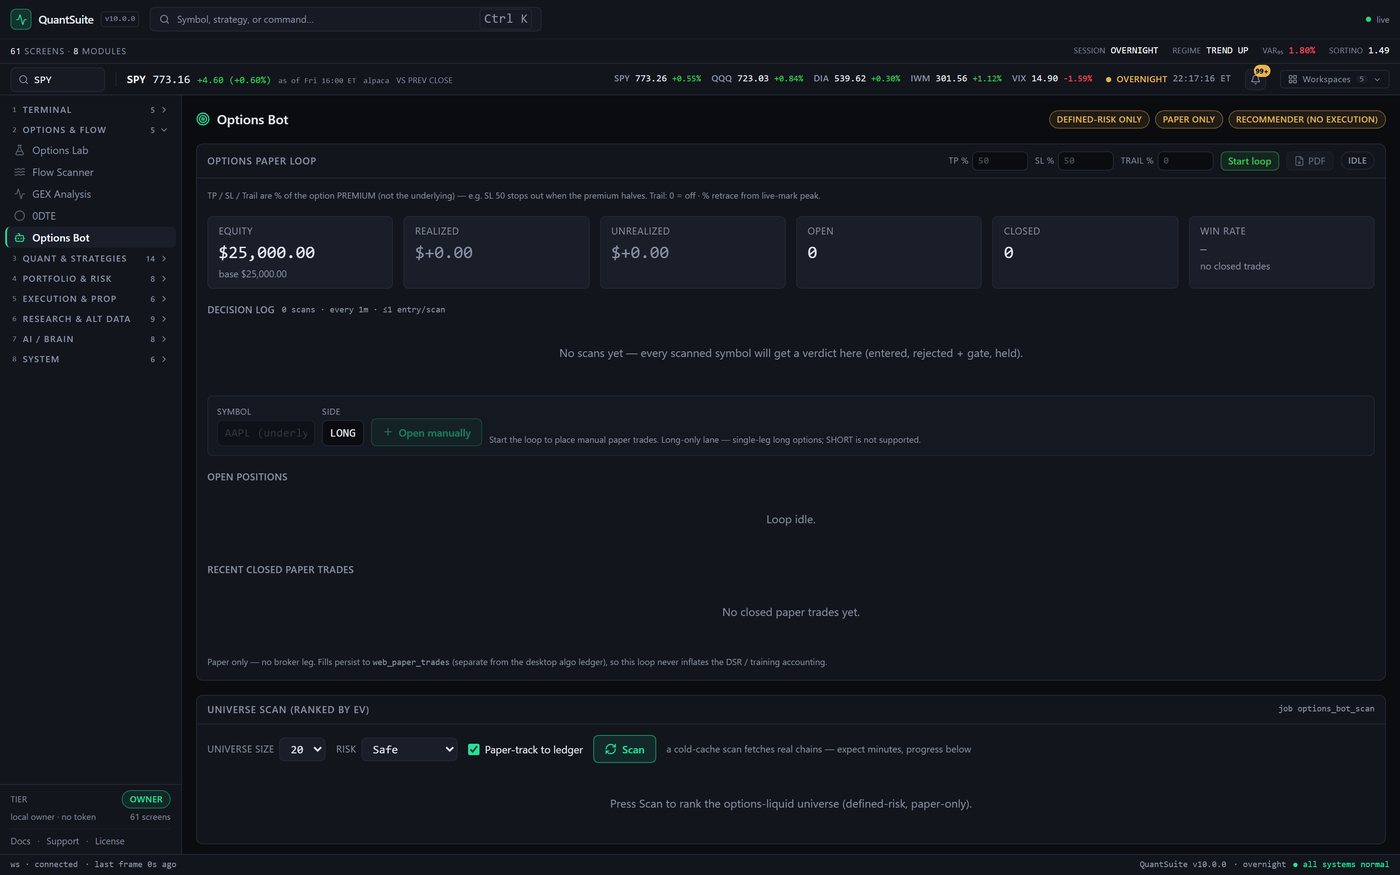
Three badges sit in the header and they are the whole product spec: DEFINED-RISK ONLY, PAPER ONLY, RECOMMENDER (NO EXECUTION). Below them a paper loop with take-profit, stop-loss and trailing controls, a decision log, an open-positions table, and a universe scan ranked by expected value.
This capture is the bot with the loop switched off, and that is deliberate: it is what you get on a fresh install, before you have asked it for anything. The header badge reads IDLE, the controls sit at their defaults (TP % 50, SL % 50, TRAIL % 0), and the book beneath is untouched: EQUITY $25,000.00 against a base of $25,000.00, realized and unrealized both $+0.00, OPEN 0, CLOSED 0, and a win rate printed as a bare — with the reason underneath: no closed trades. Not 0%, not 50%, not a demo record — a dash and an explanation. The decision log says 0 scans · every 1m · ≤1 entry/scan and “No scans yet — every scanned symbol will get a verdict here (entered, rejected + gate, held).” Open positions reads Loop idle; closed trades reads No closed paper trades yet. The universe scanner says “Press Scan to rank the options-liquid universe (defined-risk, paper-only)” and warns that a cold-cache scan fetches real chains — expect minutes. It would rather make you wait for real chains than serve you a cached-looking sample.
Three constraints are spelled out where you cannot miss them. The controls are labelled “TP / SL / Trail are % of the option PREMIUM (not the underlying)” — the ambiguity that quietly ruins a stop. The manual-entry row states its own limit rather than failing later: “Long-only lane — single-leg long options; SHORT is not supported.” And at the foot of the loop: “Paper only — no broker leg. Fills persist to web_paper_trades (separate from the desktop algo ledger), so this loop never inflates the DSR / training accounting.” Simulated fills are kept in their own table specifically so they can never leak into the statistics on the rest of this page.
Real captureNo execution pathLoop idle on a fresh book · win rate is a dash, not a 0% · paper fills kept out of the DSR accounting
05Neural AI
Algo Bot — the Quant Brain
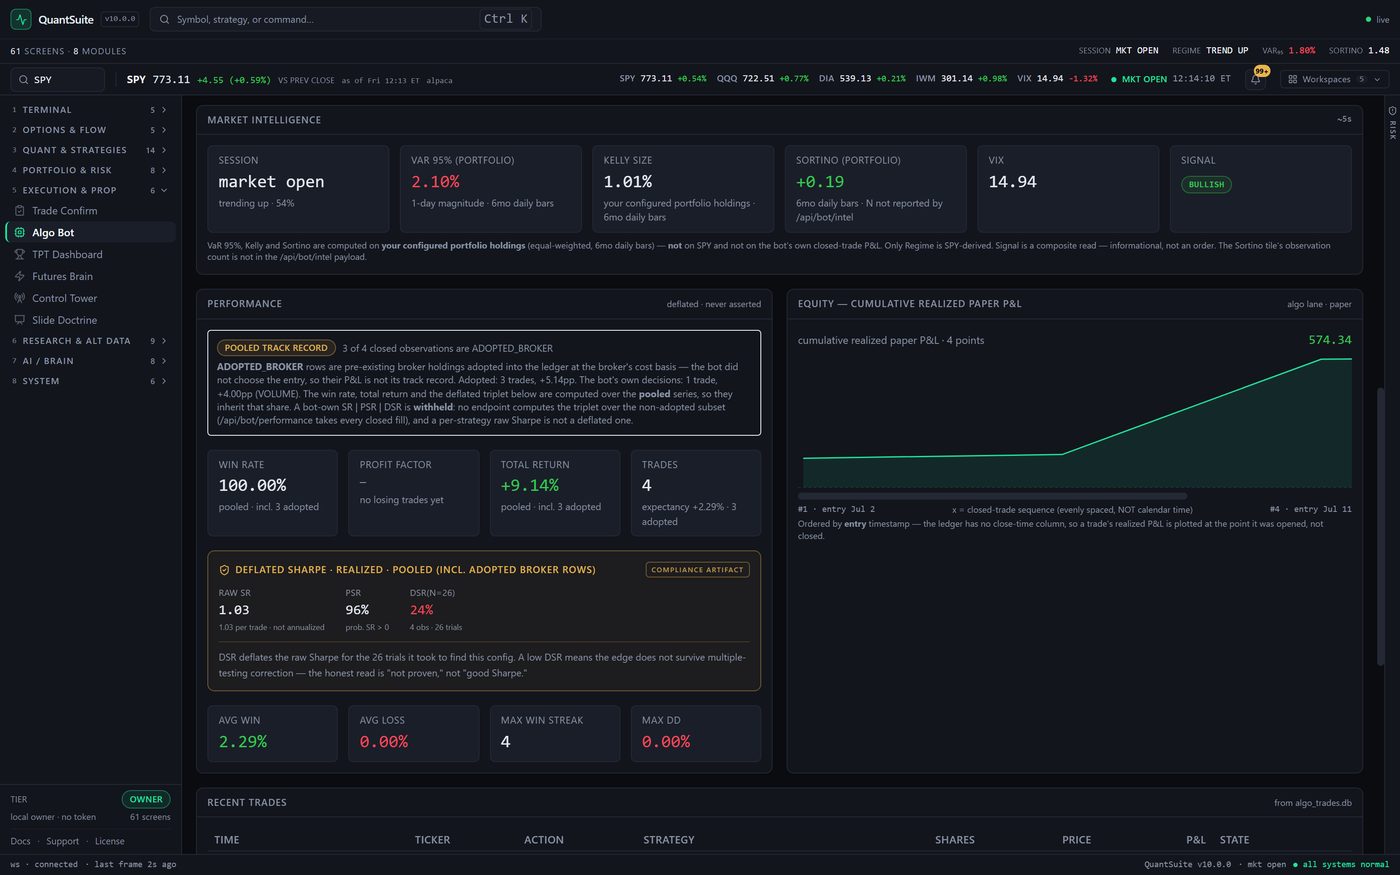
The trading engine, scrolled to its scoreboard. Above this frame sit the run state and the paper loop; here are the two panels that decide whether you should believe any of it. Market Intelligence reads SESSION market open (trending up · 54%), VAR 95% (PORTFOLIO) 2.10%, KELLY SIZE 1.01%, SORTINO (PORTFOLIO) +0.19, VIX 14.94, SIGNAL BULLISH — and then immediately tells you what those numbers are not: they are computed on your configured holdings, “not on SPY and not on the bot’s own closed-trade P&L”, only the regime is SPY-derived, the signal is “informational, not an order”, and the Sortino tile’s observation count “is not in the /api/bot/intel payload” — so it is not printed.
Now the Performance panel, headed deflated · never asserted, because it is this whole product in one screen. Win rate 100.00%. Total return +9.14%. Four trades. A 100% win rate is the number that sells trading software — and the panel’s first act is to take it away from us. A badge reads POOLED TRACK RECORD — 3 of 4 closed observations are ADOPTED_BROKER, and the note explains that adopted rows are pre-existing broker holdings absorbed at the broker’s cost basis, “the bot did not choose the entry, so their P&L is not its track record.” The bot’s own decisions: one trade. And a bot-only triplet is withheld rather than estimated, because no endpoint computes it over the non-adopted subset.
Under that, boxed as a COMPLIANCE ARTIFACT: RAW SR 1.03 · PSR 96% · DSR(N=26) 24%. PSR, judging only the length and shape of a four-observation record, hands back 96%. DSR deflates the same Sharpe against the 26 trials it took to find this configuration and prints 24%. The panel then writes the conclusion out for you: “A low DSR means the edge does not survive multiple-testing correction — the honest read is ‘not proven,’ not ‘good Sharpe.’” Note also the profit factor beside the win rate: a dash and no losing trades yet, where a lazier screen would have divided by zero and printed something infinite.
Real captureNot provenOur own bot · RAW SR 1.03 | PSR 96% | DSR(N=26) 24% — and 3 of its 4 wins disowned as adopted broker rows
06Neural AI
Neural Pattern Analysis
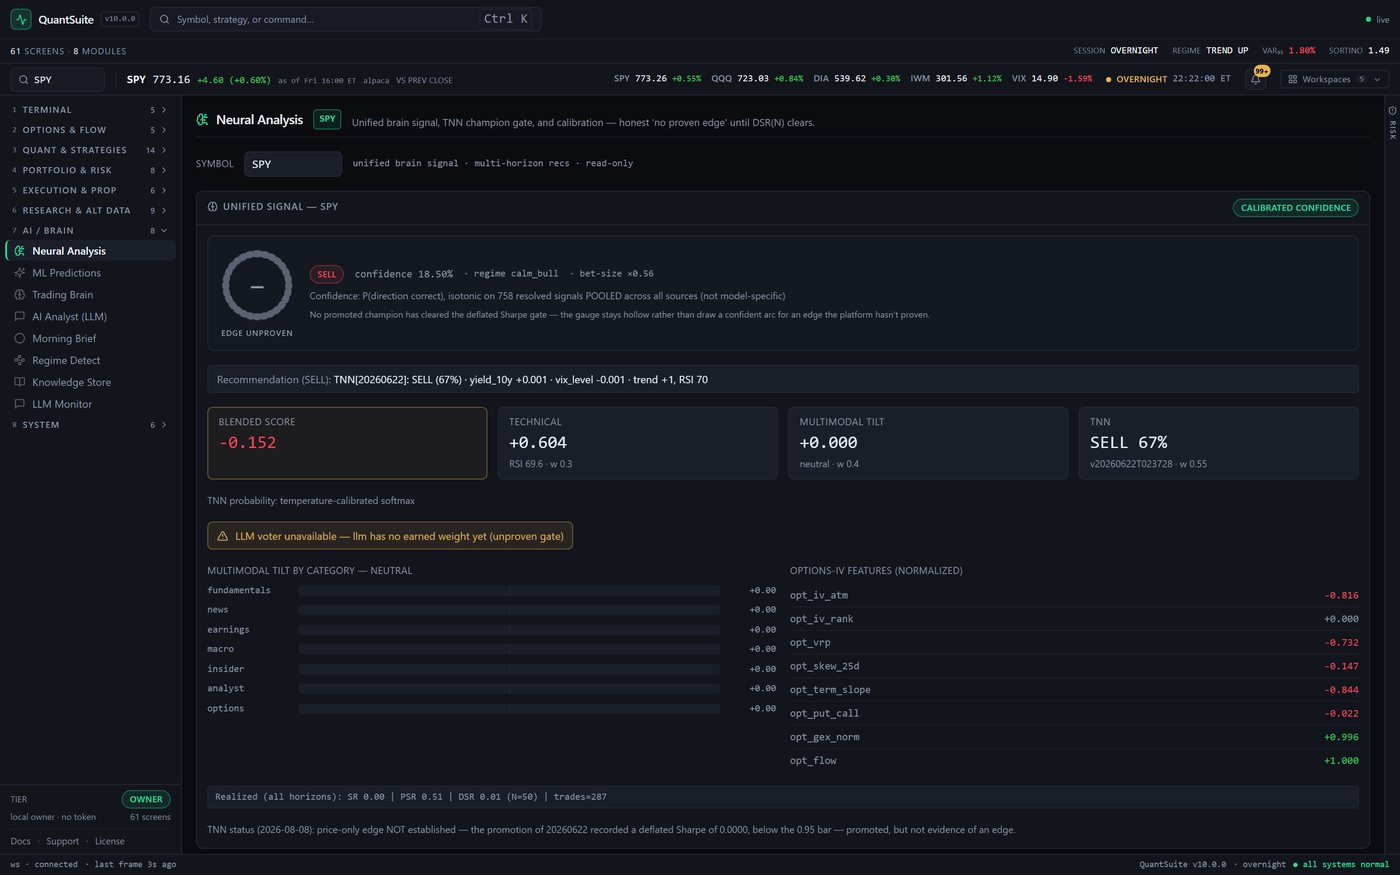
Per-ticker analysis from the neural stack: a blended score assembled from a technical read, a multimodal tilt across seven evidence categories, normalised options-IV features, and the transformer itself. The screen’s own subtitle sets the terms — “Unified brain signal, TNN champion gate, and calibration — honest ‘no proven edge’ until DSR(N) clears.”
Captured on SPY. The verdict is SELL at confidence 18.50%, regime calm_bull, bet size ×0.56. The panel is badged CALIBRATED CONFIDENCE, and yet the gauge to its left is empty — a hollow ring with a dash in the middle and the words EDGE UNPROVEN under it. The caption explains the design decision: “No promoted champion has cleared the deflated Sharpe gate — the gauge stays hollow rather than draw a confident arc for an edge the platform hasn’t proven.” That is a UI element deliberately built not to fill up, on the same card as a live directional call. The confidence figure itself is footnoted as P(direction correct), isotonic on 758 resolved signals POOLED across all sources (not model-specific) — 18.50% is not a bullish-or-bearish strength reading, it is the probability the direction is right at all.
The component tiles disagree with each other in public: BLENDED SCORE -0.152, TECHNICAL +0.604 (RSI 69.6 · w 0.3), MULTIMODAL TILT +0.000 (neutral · w 0.4), and the transformer itself reading TNN SELL 67% (v20260622T023728 · w 0.55). The technicals are the most bullish thing on the screen and the model is the most bearish; the blend lands negative and the headline follows the model, with the reasoning printed in one line — TNN[20260622]: SELL (67%) · yield_10y +0.001 · vix_level -0.001 · trend +1, RSI 70. The multimodal breakdown is honest about being nothing: all seven evidence categories — fundamentals, news, earnings, macro, insider, analyst, options — read +0.00. And a fifth voter is missing and says so: an amber bar reads “LLM voter unavailable — llm has no earned weight yet (unproven gate)”. The on-device model does not get a vote until it has earned one.
Two lines run along the bottom, and they are the ones we would cut if this were a brochure. Realized (all horizons): SR 0.00 | PSR 0.51 | DSR 0.01 (N=50) | trades=287. And then, dated: “TNN status (2026-08-08): price-only edge NOT established — the promotion of 20260622 recorded a deflated Sharpe of 0.0000, below the 0.95 bar — promoted, but not evidence of an edge.” The model that just produced the SELL on this very screen is labelled, directly underneath it, as not evidence of an edge.
Real captureEdge unprovenSPY · SELL at 18.50% · the gauge stays hollow by design · SR 0.00 | PSR 0.51 | DSR 0.01 (N=50)
07Feedback Loop
Control Tower — the ML feedback loop
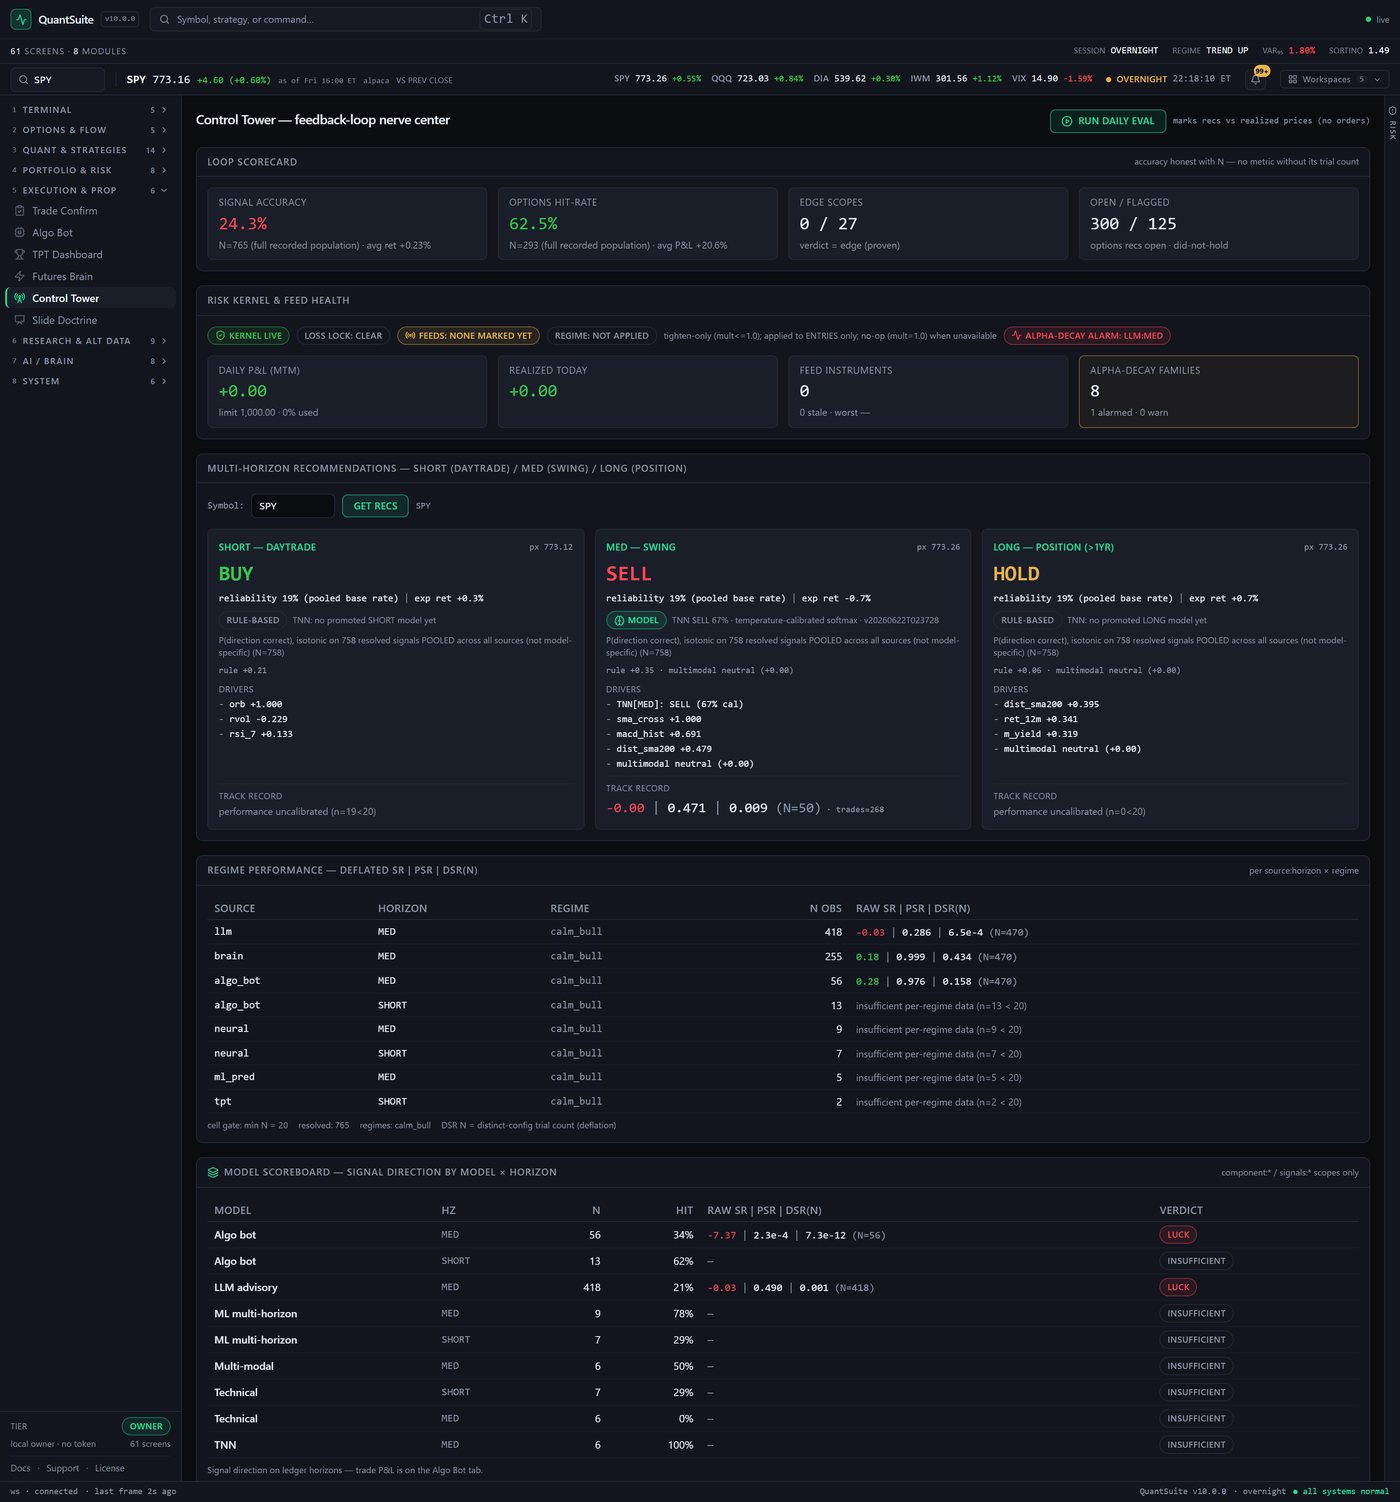
This is where predictions are held accountable — the screen calls itself the feedback-loop nerve center, and its one button is RUN DAILY EVAL, annotated “marks recs vs realized prices (no orders)”. A loop scorecard totals every call the platform has made, a risk-kernel strip shows the live safety invariants, multi-horizon recommendations carry their own track record beneath each call, and two tables underneath grade the platform’s own models by regime and by horizon.
The scorecard header states the rule the panel is built around: “accuracy honest with N — no metric without its trial count.” Then it applies it to us. SIGNAL ACCURACY 24.3% over N=765 (full recorded population, avg return +0.23%). OPTIONS HIT-RATE 62.5% over N=293 (avg P&L +20.6%). OPEN / FLAGGED 300 / 125 — a hundred and twenty-five of our own recommendations tagged did-not-hold, counted on the front page rather than buried. And the tile that matters most: EDGE SCOPES 0 / 27, where the caption defines the numerator as verdict = edge (proven). Twenty-seven scopes have been graded and none of them has cleared the bar.
The risk-kernel strip reads KERNEL LIVE, LOSS LOCK: CLEAR, REGIME: NOT APPLIED, in amber FEEDS: NONE MARKED YET, and in red ALPHA-DECAY ALARM: LLM:MED. A breaker that has never seen a mark is not a green light, and the board declines to colour it like one; an alpha-decay monitor that has just tripped on our own LLM family is printed in the strip rather than left in a log, and the tile beside it counts ALPHA-DECAY FAMILIES 8 with 1 alarmed · 0 warn. Daily P&L reads +0.00 against a limit 1,000.00 · 0% used, and FEED INSTRUMENTS 0 is why the feed breaker has nothing to mark.
Underneath, three horizons on SPY, and they do not agree: daytrade says BUY (exp ret +0.3%), swing says SELL (-0.7%), position says HOLD (+0.7%) — all three at the same reliability 19% (pooled base rate), which is the platform’s pooled base rate rather than a per-call score. Two of the three are tagged RULE-BASED with the reason spelled out — “TNN: no promoted SHORT model yet”, “TNN: no promoted LONG model yet” — so you know which calls a model is actually behind, and only the middle card carries the green MODEL badge. Each card carries its own record: performance uncalibrated (n=19<20) for the short horizon, (n=0<20) for the long, and for the one card a model is driving, -0.00 | 0.471 | 0.009 (N=50) · trades=268. Every driver behind every call — orb +1.000, rvol -0.229, rsi_7 +0.133, sma_cross +1.000, macd_hist +0.691, dist_sma200 +0.479, ret_12m +0.341 — is listed with its weight.
Then the two tables this frame was widened to include, because between them they are the whole argument. Regime performance lists eight source × horizon cells; three of them have enough data and print a full triplet (llm/MED over 418 obs: -0.03 | 0.286 | 6.5e-4 (N=470); brain/MED over 255: 0.18 | 0.999 | 0.434 (N=470); algo_bot/MED over 56: 0.28 | 0.976 | 0.158 (N=470)). The other five print no statistic at all — just “insufficient per-regime data” and the count they actually have, against a stated cell gate: min N = 20. Note what the three that did qualify say: a raw Sharpe of 0.18 with a PSR of 0.999 still deflates to a DSR of 0.434 once the 470 trials are accounted for, and llm/MED — the largest sample on the board — deflates to 6.5e-4.
And the model scoreboard below it grades each model × horizon and puts its verdict in one word. Nine rows. Two read LUCK, and they are the two with enough data to be judged: Algo bot/MED (56 obs, hit 34%, -7.37 | 2.3e-4 | 7.3e-12 (N=56)) and LLM advisory/MED (418 obs, hit 21%, -0.03 | 0.490 | 0.001 (N=418)). Having the sample and printing a negative Sharpe is the worse outcome, and it is the one our two largest producers get. The other seven read INSUFFICIENT, and their RAW SR | PSR | DSR(N) column is a bare — rather than a number. The row worth pausing on is the last one — TNN, horizon MED, N of 6, hit 100%. A hundred per cent hit rate — the single most sellable number this software could put on a screenshot — sitting next to no Sharpe at all and the verdict INSUFFICIENT, because six observations do not support a claim. Nothing on this board reads edge, which is where the EDGE SCOPES 0 / 27 tile at the top of the same screen gets its zero.
Real capture0 of 27 provenOur own calls, graded — signal accuracy 24.3% (N=765) · 125 flagged did-not-hold · an alpha-decay alarm on our own LLM · 7 of 9 models stamped INSUFFICIENT · zero scopes reach “edge (proven)”
08Quant
Risk Engine
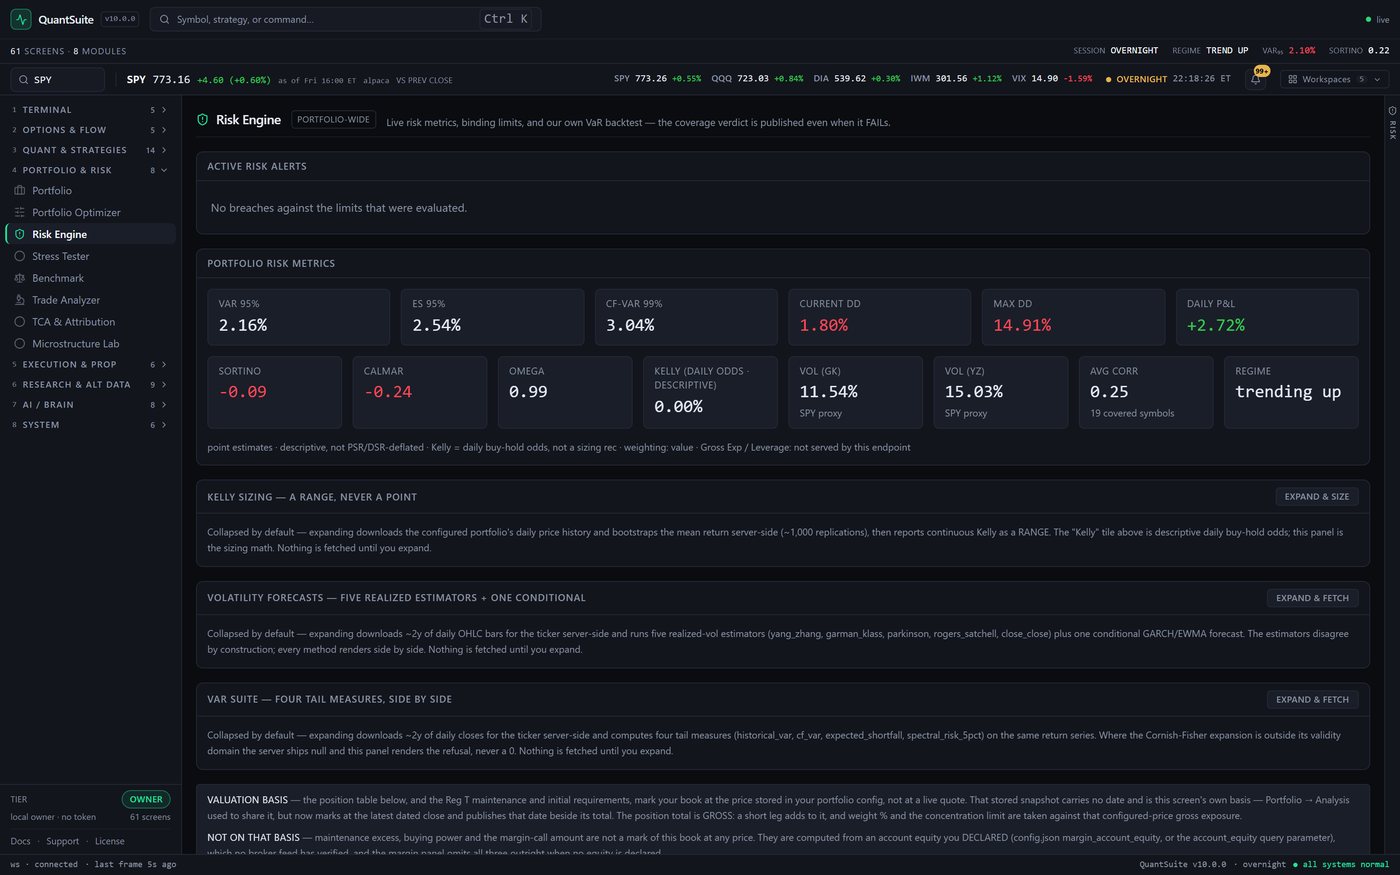
A dedicated risk dashboard over the configured book. Its subtitle is the promise the rest of the screen keeps: “Live risk metrics, binding limits, and our own VaR backtest — the coverage verdict is published even when it FAILs.”
Computed in this capture: VaR 95% 2.16%, ES 95% 2.54%, CF-VaR 99% 3.04%, current drawdown 1.80%, max drawdown 14.91%, daily P&L +2.72%, Sortino -0.09, Calmar -0.24, Omega 0.99, Garman-Klass vol 11.54% and Yang-Zhang vol 15.03% — both tagged SPY proxy, so you are not told they were measured on your own book — average correlation 0.25 over 19 covered symbols, regime trending up. Sortino and Calmar are both negative and both printed in the loss colour. A risk screen that only ever shows you green is not a risk screen.
Read the basis line under the tiles, which qualifies four things in one breath: “point estimates · descriptive, not PSR/DSR-deflated · Kelly = daily buy-hold odds, not a sizing rec · weighting: value · Gross Exp / Leverage: not served by this endpoint.” The Kelly tile reads 0.00% and is explicitly labelled descriptive so it cannot be mistaken for a position size; gross exposure and leverage are absent rather than zeroed, and the line says which endpoint is missing them.
Three heavy panels sit collapsed below — a Kelly range, five realized volatility estimators plus a conditional forecast, and four tail measures side by side — each stating “Nothing is fetched until you expand.” The screen will not quietly download two years of bars to decorate itself. And the tail panel pre-commits to a refusal: “Where the Cornish-Fisher expansion is outside its validity domain the server ships null and this panel renders the refusal, never a 0.” The alerts panel at the top is equally careful with its scope — it does not say “no risk”, it says No breaches against the limits that were evaluated.
Real captureConfigured book · VaR 2.16% · CF-VaR 3.04% · Sortino -0.09 and Calmar -0.24 in the loss colour · gross exposure absent, not zeroed
09Analytics
Institutional Backtester
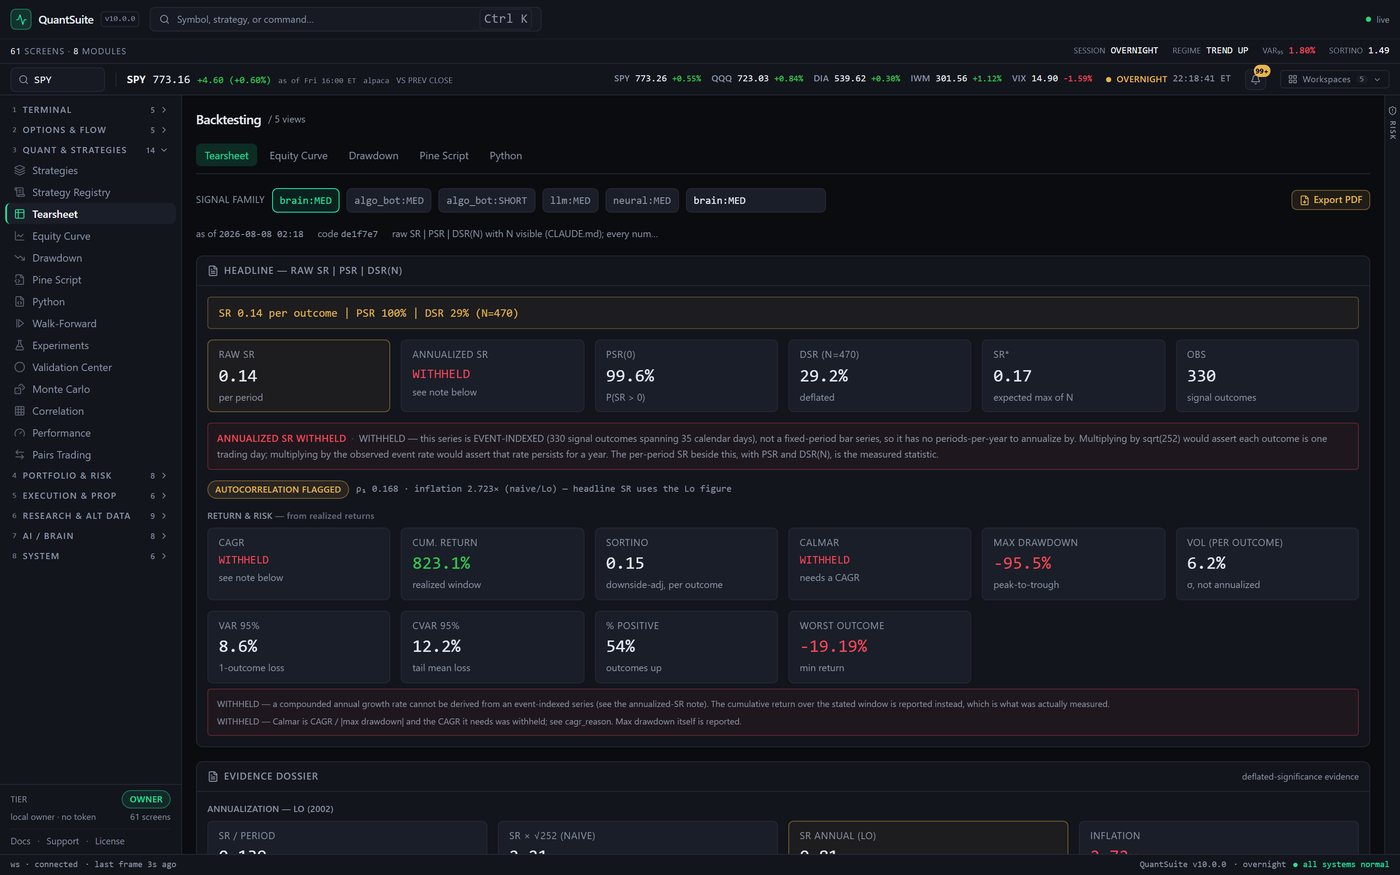
Five views over one result — tearsheet, equity curve, drawdown, and exports to Pine Script and Python — driven by a signal-family selector (brain:MED, algo_bot:MED, algo_bot:SHORT, llm:MED, neural:MED). Every run is stamped with when and against which build: as of 2026-08-08 02:18 · code de1f7e7, over the line raw SR | PSR | DSR(N) with N visible (CLAUDE.md); every numeric leaf carries Provenance.
The tearsheet leads with the triplet, not with a return: SR 0.14 per outcome | PSR 100% | DSR 29% (N=470), broken out into RAW SR 0.14, PSR(0) 99.6%, DSR (N=470) 29.2%, SR* 0.17 — expected max of N, the Sharpe you would expect from 470 tries of pure noise — over OBS 330 signal outcomes. Our raw Sharpe barely clears the number a random search would have produced anyway, and the panel puts the two side by side so you can see it.
Then three refusals, each with its reasoning printed in full. ANNUALIZED SR reads WITHHELD: the series is event-indexed — 330 signal outcomes spanning 35 calendar days — so there is no periods-per-year to annualize by, and “multiplying by sqrt(252) would assert each outcome is one trading day.”CAGR is withheld for the same reason. CALMAR is withheld because it is CAGR over max drawdown and the CAGR it needs was withheld. An amber chip reads AUTOCORRELATION FLAGGED · ρ₁ 0.168 · inflation 2.723× (naive/Lo), and states that the headline uses the deflated Lo figure rather than the naive one that would have been 2.7 times larger.
And it does not hide behind the withholding, either. Beside those refusals it prints CUM. RETURN 823.1% over the realized window — and immediately next to it MAX DRAWDOWN -95.5% in red, WORST OUTCOME -19.19%, % POSITIVE 54%, CVAR 95% 12.2%, VAR 95% 8.6%, SORTINO 0.15 (downside-adj, per outcome) and a per-outcome vol of 6.2% flagged σ, not annualized. An 823% cumulative return is exactly the figure a screenshot on a competitor’s site would crop to. Here it is stapled to a 95.5% peak-to-trough drawdown, a deflated Sharpe of 29%, and a note that the annualised version of it cannot honestly be computed.
Real capture3 metrics withheldSR 0.14 | PSR 100% | DSR 29% (N=470) · SR* 0.17 expected from noise · 823.1% cumulative beside -95.5% max drawdown · methodology
10Portfolio
Portfolio Management
Track holdings with cost basis, P&L, weight and lot count; analyze them for risk (annual return, volatility, Sortino, Calmar, beta, alpha, max drawdown, VaR and CVaR 95%, concentration); see allocation and sector exposure; and optionally link a brokerage — through the broker’s own hosted portal, with a diff-then-confirm import and no order routing to the linked account at all — not from the browser, not from anywhere in this version.
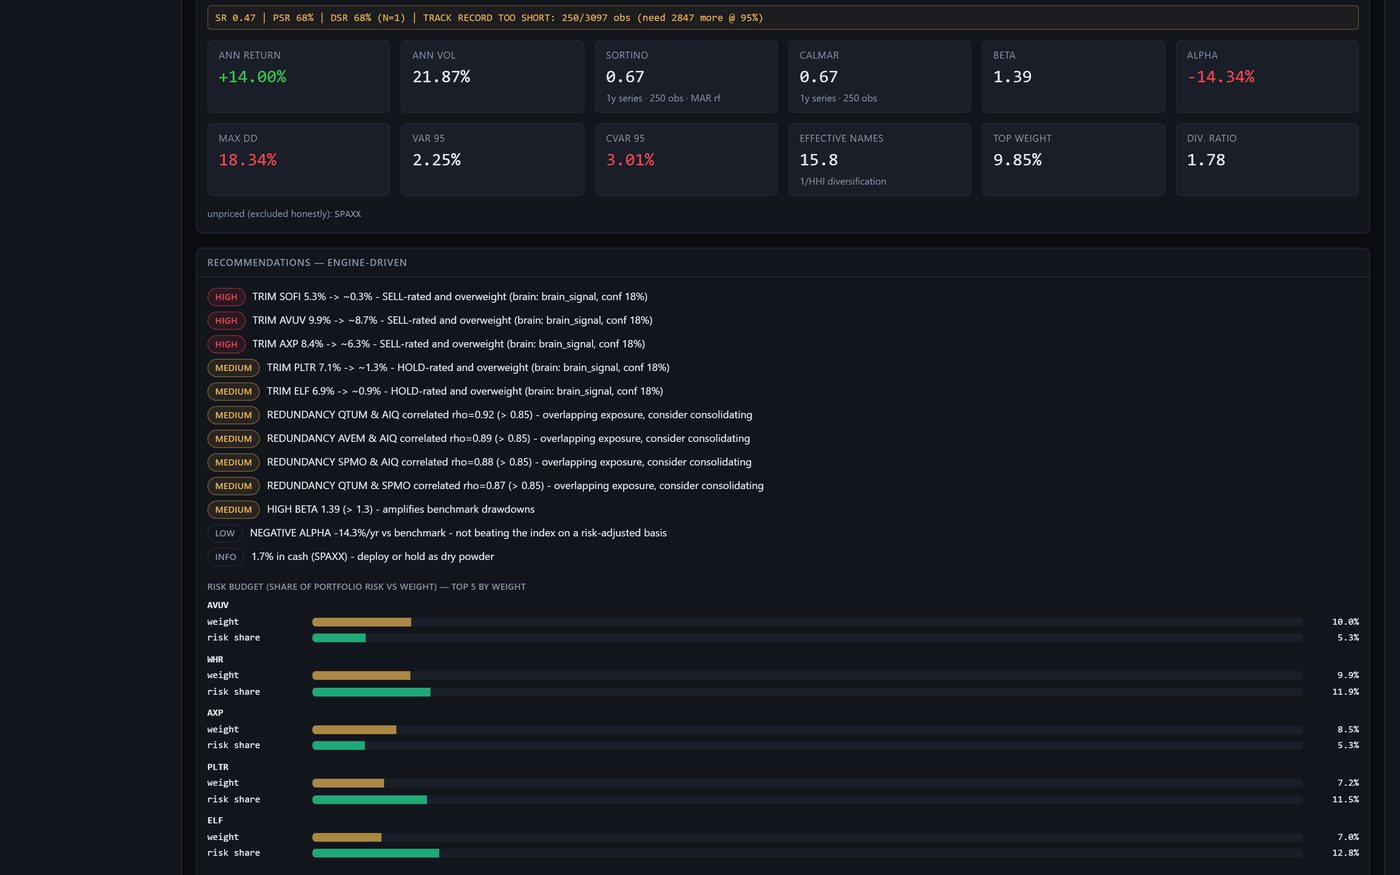
This capture is one of our own accounts, framed on the risk panel — the top of that screen carries the holdings table and the brokerage link, which are our positions and our broker account, so the frame starts below them. An amber line runs the width of the panel: SR 0.47 | PSR 68% | DSR 68% (N=1) | TRACK RECORD TOO SHORT: 250/3097 obs (need 2847 more @ 95%). That is the doctrine applied to our own book — a Sharpe is quoted, deflated beside it, and then the panel says outright that 250 observations is not enough to conclude anything, and names how many more it would take.
The rest of the panel is not flattering and is not meant to be. Alpha -14.34% against the benchmark. Beta 1.39, flagged HIGH BETA (> 1.3) — amplifies benchmark drawdowns. Max DD 18.34%, Sortino 0.67, Calmar 0.67, each stamped 1y series · 250 obs so the window is never implied to be longer than it is. The cash line is listed exactly as the panel words it — unpriced (excluded honestly): SPAXX — rather than being carried at a made-up mark.
Below the metrics the engine argues with the book: five TRIM recommendations naming the rating and the conviction behind each (brain_signal, conf 18% — the confidence is disclosed, and it is low), four REDUNDANCY pairs with their correlations (QTUM & AIQ rho=0.92, AVEM & AIQ 0.89, SPMO & AIQ 0.88, QTUM & SPMO 0.87), and a plain NEGATIVE ALPHA -14.3%/yr vs benchmark — not beating the index on a risk-adjusted basis. A risk-budget table then splits each holding's share of portfolio risk from its share of weight, which is where a 10.0% position showing a 5.3% risk share becomes legible.
Real captureVaR not coverage-testedOur own book · VaR 2.16% shown but stamped untested — 124 of the 310 observations its coverage test needs · no live trading in this version
// the database
The Data Center: open the hood on every table
Everything the platform records — trades, signals, model telemetry, options recommendations, the trial ledger behind DSR(N) — lives in local SQLite files on your machine. The Data Center is a read-only console over all 47 registered platform databases — a count read off the registry the server ships with, not off the four pictures below — so you can audit what the software knows about you, and about itself.
Three things to know before you read these four. First, they are the same web terminal as the ten screens above — same chrome, same ticker strip, same sidebar — reached by clicking Data Center under 8 SYSTEM in the terminal’s own navigation, which is where the highlight sits in the first three frames. Second, they were taken on 2026-08-08 against a neutral install — no positions, empty watchlist — which is why the header strip reads REGIME —, VaR₉₅ — and SORTINO — instead of numbers: there is no book to compute them over, and the quote beside them is stamped as of Fri 16:00 ET because the tape was shut. Third, the first three frames are scrolled past the console’s front page: the registry catalog — the per-database list with its sizes, cadences and backup times — sits above the top of those three shots, so what you are looking at is the console you land in once you have picked a store, not the list you picked it from. The fourth is not a console frame at all — it is the Knowledge Store screen, shown from its own top, and the catalog is not on that screen at any scroll position.
And every value is printed exactly as it is stored: this is an audit tool, not a report, so nothing is rounded, padded or filled in on the way out to make a column look tidy.
Schema — the real DDL, including the empty table
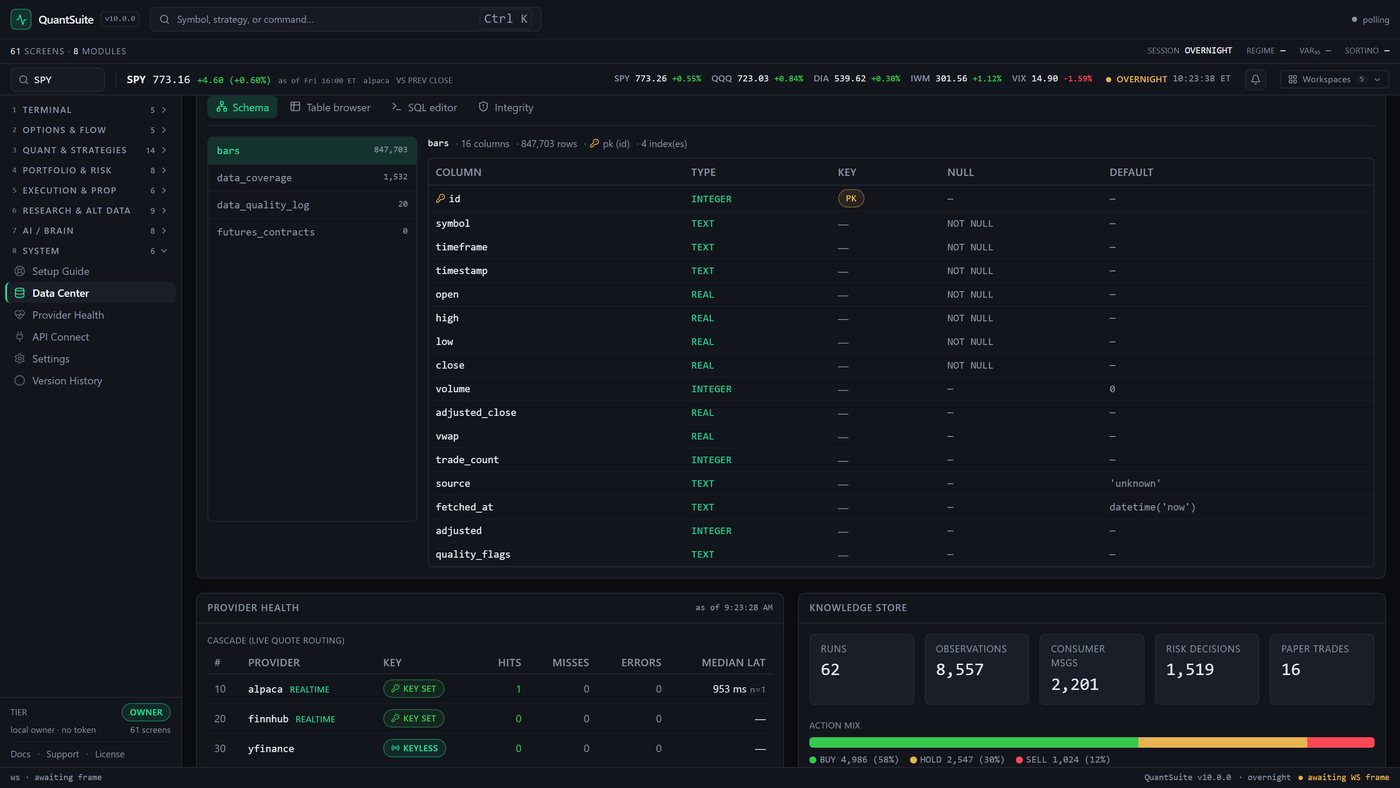
The console carries four tabs — Schema, Table browser, SQL editor, Integrity — and this is the first, pointed at the market-data store. The table list on the left carries each table’s row count rather than making you go and find it: bars 847,703, data_coverage 1,532, data_quality_log 20, and futures_contracts 0. That last row is the one worth noticing. An empty table is listed with its zero, in the same type as the full one, instead of being dropped from the list because it looks like a gap.
The header for the selected table reads bars · 16 columns · 847,703 rows · pk (id) · 4 index(es), and the grid under it is the actual schema, column by column, with type, key, nullability and default. symbol, timeframe and timestamp are TEXT NOT NULL; the four OHLC columns are REAL NOT NULL; volume defaults to 0; source defaults to 'unknown' and fetched_at to datetime('now'); and adjusted_close, vwap, trade_count, adjusted and quality_flags are nullable. A provenance column that defaults to 'unknown' rather than to a provider name is a small thing to ship, and it is the reason the rows in the next figure can tell you where they came from. Below the console the same page keeps going: a provider cascade with alpaca and finnhub both KEY SET and yfinanceKEYLESS, their hits, misses and errors counted, and a median latency of 953 ms quoted with the n=1 it was measured over.
Real capturebars · 16 columns · 847,703 rows · pk (id) · 4 index(es) — and the empty futures_contracts table listed at its 0, not hidden
Table browser — rows exactly as stored, nulls included
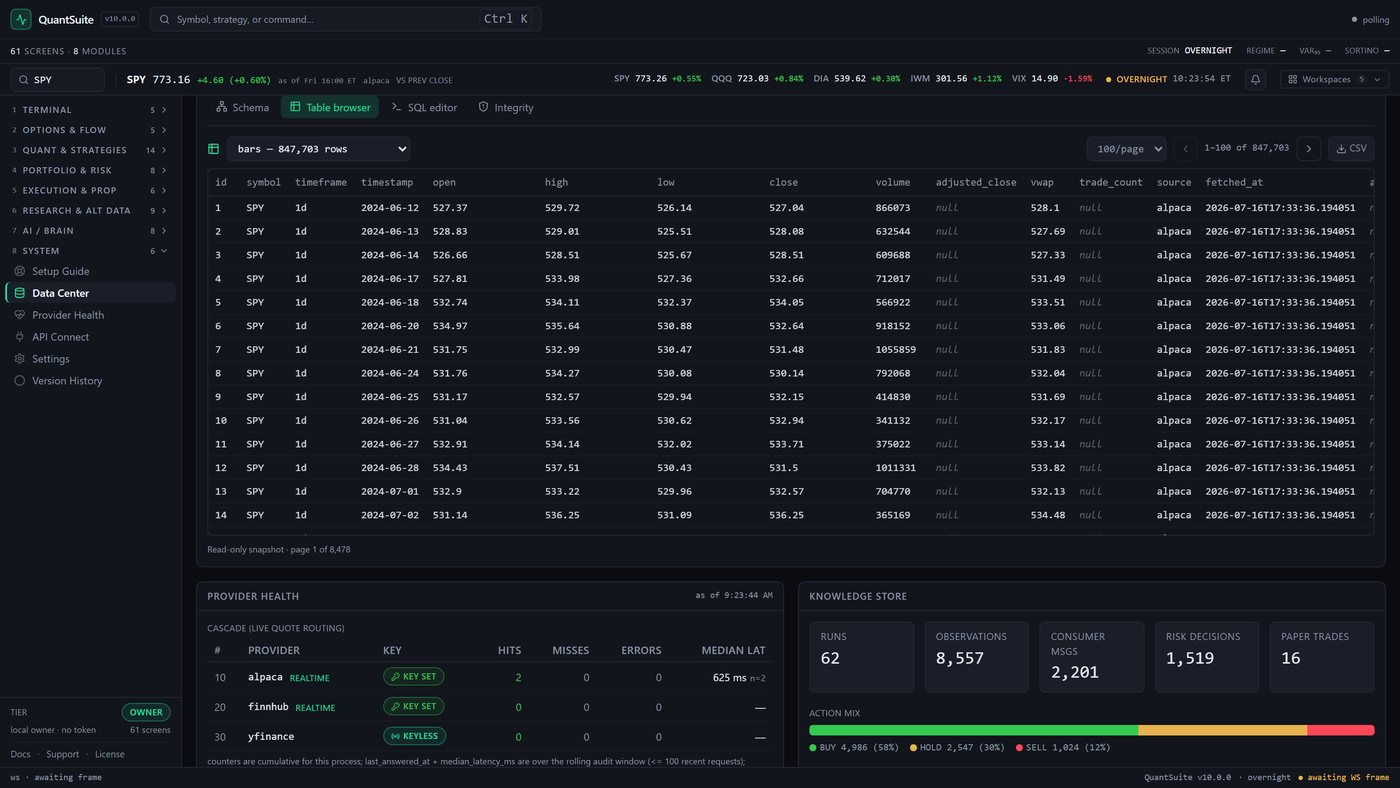
The second tab paginates any table in the store. Here it is bars — 847,703 rows at a hundred to a page, labelled 1 – 100 of 847,703, with a CSV button beside it and, under the grid, the line that governs the whole console: Read-only snapshot · page 1 of 8,478.
Read the rows rather than the chrome. Every one is a daily SPY bar written by the same fetch — the first is SPY · 1d · 2024-06-12 · O 527.37 · H 529.72 · L 526.14 · C 527.04 · V 866073 — and its vwap is stored as 528.1, not 528.10, because the browser prints what SQLite holds and a tidied column is a changed column. Then look at three columns that repeat down every row in frame: adjusted_close, trade_count and adjusted each read a literal, italicised null. Not 0, not an empty cell. These bars were stored without an adjustment factor, and the browser says absent rather than picking a number that would read as measured — which is the whole difference between a split you have not accounted for and a split that happened to be 1.0. Beside them source reads alpaca on every row, and fetched_at carries the ISO instant of the fetch down to the microsecond, unrounded, so any row on this screen can be traced back to the call that produced it.
Real capture1 – 100 of 847,703 · Read-only snapshot · page 1 of 8,478 — vwap stored as 528.1, and three columns printing null instead of a zero that would read as measured
Integrity — the console finds a real failure in our own data
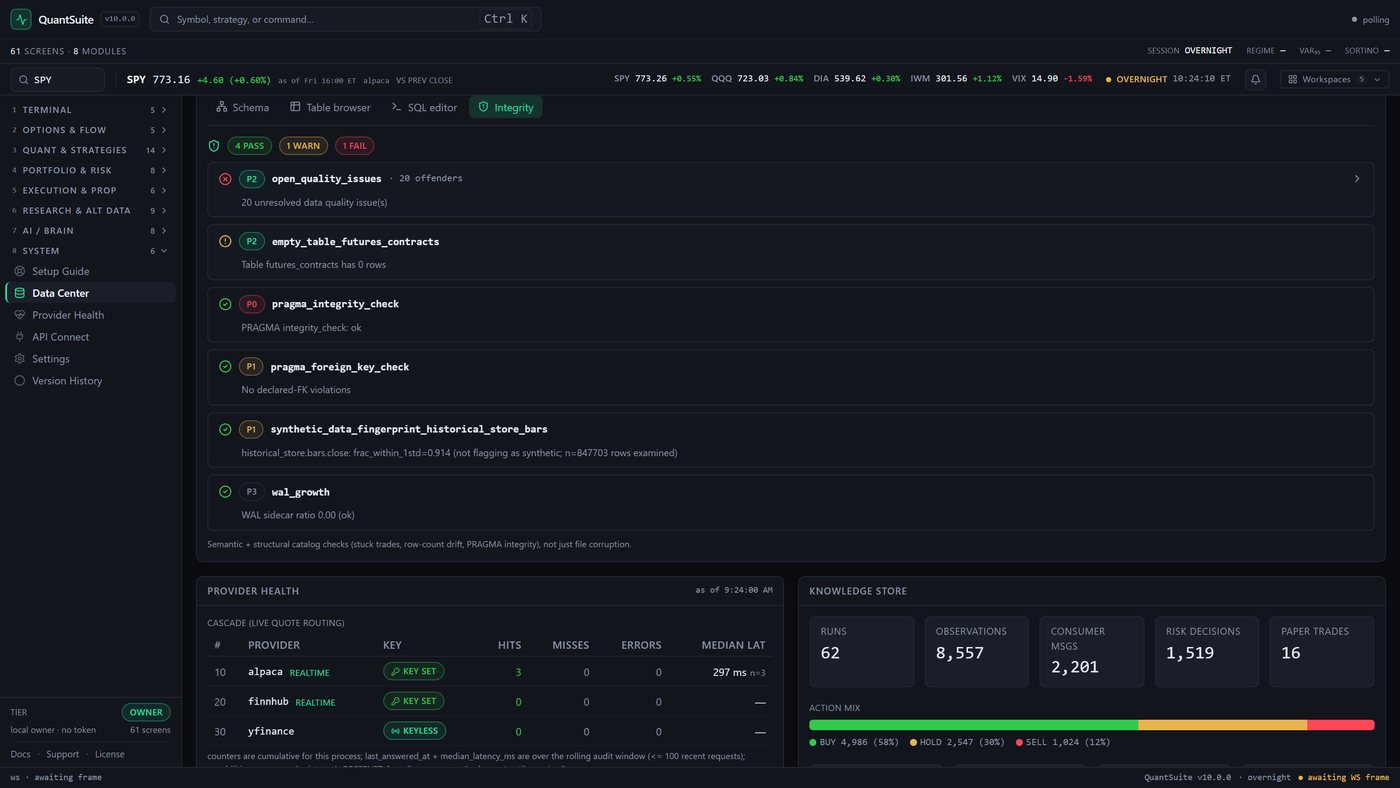
The last tab runs the store’s catalog of integrity checks and totals them in the header: 4 PASS · 1 WARN · 1 FAIL. The failure is ours, it is on our own data, and it is the first thing on the screen: P2 open_quality_issues · 20 offenders, “20 unresolved data quality issue(s)”, with a chevron to open the offending rows. Under it the warning, P2 empty_table_futures_contracts — “Table futures_contracts has 0 rows” — which is the same zero the Schema tab printed, promoted from a fact into a finding.
We could have picked a store with nothing wrong with it. An audit console that finds nothing is not evidence that it works; one that finds a real problem in its owner’s own data is. Below the two, four checks pass, and each says what it actually proved rather than just going green: P0 pragma_integrity_check — “PRAGMA integrity_check: ok”; P1 pragma_foreign_key_check — “No declared-FK violations”, which is a narrower claim than “the references are sound”, and worded that way on purpose; P3 wal_growth — “WAL sidecar ratio 0.00 (ok)”; and the one that exists because of the argument this whole site makes, P1 synthetic_data_fingerprint_historical_store_bars, reporting “historical_store.bars.close: frac_within_1std=0.914 (not flagging as synthetic; n=847703 rows examined)”. The product tests its own market data for the fingerprint of having been generated rather than downloaded, prints the statistic and the sample it tested it over, and — because it passed — reports no offenders at all instead of counting the population it just cleared. The footer states the scope of the whole list: “Semantic + structural catalog checks (stuck trades, row-count drift, PRAGMA integrity), not just file corruption.”
Real capture1 fail4 PASS · 1 WARN · 1 FAIL on our own store — we shipped the picture of the failure (open_quality_issues · 20 offenders), next to a synthetic-data fingerprint that passed over 847,703 rows and claimed no offenders for doing so
Knowledge Store — what the brain has recorded about itself
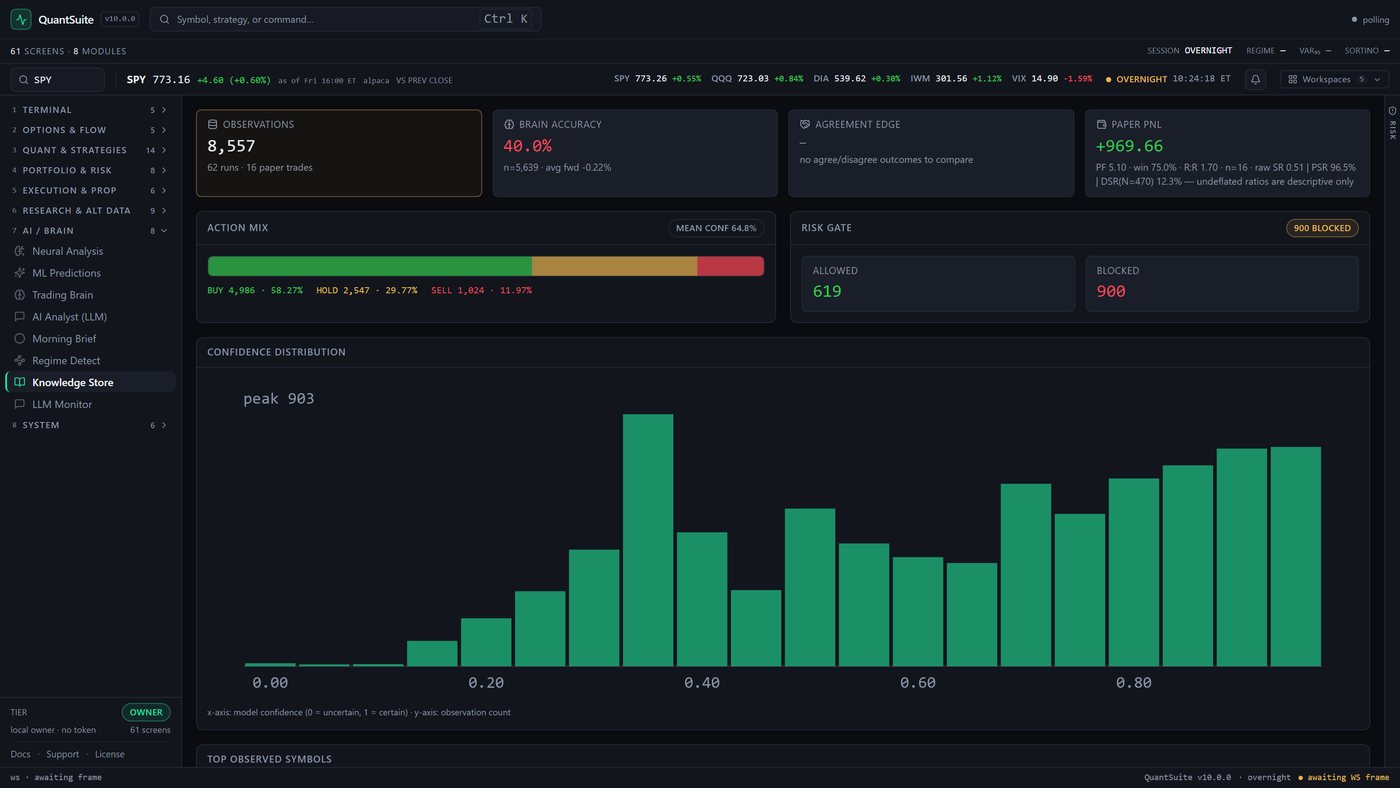
The fourth figure is a different screen in the same family: Knowledge Store, which the sidebar files under 7 AI / BRAIN. It reads the local stores back as a scoreboard — OBSERVATIONS 8,557 over 62 runs · 16 paper trades — and it is on this page because of the four tiles across its top, not in spite of them.
BRAIN ACCURACY 40.0%, printed in the loss colour, with its sample and its realized outcome beside it: n=5,639 · avg fwd -0.22%. Forty per cent, over five and a half thousand graded observations, on our own front page. AGREEMENT EDGE is a bare — with the reason under it — “no agree/disagree outcomes to compare” — rather than an absence rounded down to a zero. And then the tile that would sell this software if we let it: PAPER PNL +969.66, subtitled PF 5.10 · win 75.0% · R:R 1.70. A 75% win rate at a profit factor of five. The same line finishes: n=16 · raw SR 0.51 | PSR 96.5% | DSR(N=470) 12.3% — undeflated ratios are descriptive only. Sixteen trades; and once the 470 trials it took to arrive at this configuration are accounted for, the deflated figure is 12.3%. The tile does not let you read the 75% without it.
The panels under the tiles keep the same discipline. The action mix is BUY 4,986 · 58.27%, HOLD 2,547 · 29.77%, SELL 1,024 · 11.97% at a mean conf 64.8% — every bucket with its count, so a percentage can be checked against the rows behind it. The risk gate is badged 900 BLOCKED against ALLOWED 619: the gate refuses more of the brain’s own signals than it passes, and the board leads with the refusals rather than the allowances. And the confidence histogram, peaking at 903, is captioned with what its axes are — x-axis: model confidence (0 = uncertain, 1 = certain) · y-axis: observation count — so a rising shape cannot be mistaken for an equity curve.
Real captureDSR 12.3%Our own brain, read back out of the local stores — accuracy 40.0% at n=5,639 · a 75.0% win rate you cannot read without DSR(N=470) 12.3% on the same line · risk gate 900 blocked against 619 allowed
mode=ro
Read-only, four layers deep
Every connection opens the file in read-only mode (mode=ro), sets PRAGMA query_only=ON, passes a statement-level guard that allows only SELECT/WITH/EXPLAIN (ATTACH, DDL, DML and multi-statement are rejected), and must match a path allow-list. The sole exception is one audited, reversible “approve/dismiss a supervisor recommendation” endpoint — and even that only writes a bounded, roll-back-able override, never a trade.
schema
Schema introspection
Full introspection of any database, read live off the file rather than from a diagram we drew: every table with its row count, and for each one its columns, types, primary key, nullability, defaults and index count. Declared foreign keys are checked too — the Integrity tab’s pragma_foreign_key_check is what reports them.
select-only sql
Browser + SQL console
A paginated table browser plus a free-form SQL editor (SELECT-only, row-capped). Query errors come back as clean messages naming the offending column — write whatever query you like against your own data.
integrity
Integrity checks
A per-database catalog of integrity checks runs on demand and reports each check’s severity, status, offending-row count and a sample of offenders. If a store has a data problem, the tool that finds it ships in the product.
csv / xlsx / parquet
Export anything
Any table or any query result exports to CSV, Excel, or Parquet. Your data is never locked in: it’s SQLite on your own disk, and the export button proves it.
cadence-labeled
Honest freshness
Each database is labeled with its expected update cadence — daily-pipeline, live, event-driven, on-demand, or deprecated — so a quiet event-driven store isn’t dressed up as “fresh” and a stale daily store can’t hide. Deprecated stores are marked, not silently refreshed to look alive.
What’s in the 43? Not something the four captures above can show you — the console’s catalog page, which lists all of them with size, table count, cadence and last backup, is scrolled off the top of the three console frames, and the fourth figure is a different screen that never carries it. Read this off the shipped registry instead. Among them: the algo trade ledger and agent weights, the closed feedback-loop ledger (signals, edge metrics, options evaluations), the brain knowledge base, the Trial Ledger that supplies N for DSR/PBO accounting, TNN training telemetry, OHLCV and feature stores, the execution order book, decision traces, and episodic market memory. Dashboards over the trade ledger report performance as the raw SR | PSR | DSR(N) triplet — the same standard as everywhere else in the product.
// seen enough?
The screenshots are the product
No render farm, no concept art. What you just scrolled through is the terminal the installer opens, including every panel that reports its own thinness instead of filling itself in.